
Partitioned Storage Engine for Enhanced Concurrent Performance
We apply partitioning to our log-structured merge-tree key/value store to allow for concurrent writes and reduce lock contention. In benchmarking across a range of workloads, we find partitioning generally doubles the overall performance of the key/value store. We also discover surprisingly poor performance when using too many partitions and/or too many threads performing concurrent operations
Introduction
In our last project, we developed a log-structured merge-tree (LSMTree) to allow for persistent reads and writes in a disk-based key/value store. In benchmarking the impact of performing concurrent operations, we discovered optimal performance was achieved with only 4 threads whereas our earlier read-only key/value store continued to scale up to 16 threads. We attribute this to lock contention whereby only a single thread at a time can perform a write operation and other writers as well as readers must wait for the lock.
In this project, we explore partitioning (i.e., sharding) to enhance the concurrent performance of our LSMTree. We develop a hash partitioner and then benchmark the partitioned LSMTree's performance with different workloads using a range of different partition counts. Partitioning generally doubles the overall performance of the LSMTree key/value store as shows that this a good approach to to addressing lock contention. We also discuss some of the drawbacks of hash partitioning as will affect the development of future features such as table scans.
Partitioning a Database
Partitioning is a general strategy for splitting a database up into separate sub-databases (i.e., partitions) that each store a portion of the full data. Each partition can then act with some level of independence.

For our key/value store, we are interested in splitting by key and for this we apply hash partitioning. A hash function is applied to each key and from the hash value a partition index is computed using modulo division. This entire computation is deterministic such that a given key will always map to the same partition index. For each partition index, we maintain an LSMTree that contains the key/value pairs for all of the keys that map to that partition. Each LSMTree is independent from the other LSMTrees and we can therefore perform concurrent operations on multiple LSMTrees without the need for any coordination between them. Hence, partitioning is expected to reduce lock contention.
Developing Our Partitioned Storage Engine
It is quite simple to develop a
HashPartitionedReadWriteStorage<K, V>
that encapsulates a
collection of
CloseableReadWriteStorage<K, V>
instances, each corresponding to a single
partition. A hash function is used to deterministically map a key to partition and each
put,
get, and
delete
operation is then delegated to the partition for that key.
HashPartitionedReadWriteStorage code
public class HashPartitionedReadWriteStorage<K, V> implements CloseableReadWriteStorage<K, V> {

  private final Function<K, Integer> hashFunction;
  private final ImmutableList<CloseableReadWriteStorage<K, V>> partitions;

  public static <K> Function<K, Integer> defaultHashFunction() {
    return Objects::hashCode;
  }

  public interface PartitionFactory<K, V> {
    CloseableReadWriteStorage<K, V> create(int partition) throws IOException;
  }

  public static <K, V> HashPartitionedReadWriteStorage<K, V>
  create(Function<K, Integer> hashFunction, int partitions, PartitionFactory<K, V> factory)
      throws IOException {
    Preconditions.checkArgument(partitions > 0);
    var builder = ImmutableList.<CloseableReadWriteStorage<K, V>>builder();
    for (int i = 0; i < partitions; i++) {
      builder.add(factory.create(i));
    }
    return new HashPartitionedReadWriteStorage<>(hashFunction, builder.build());
  }

  public static <K, V> HashPartitionedReadWriteStorage<K, V>
  create(int partitions, PartitionFactory<K, V> factory) throws IOException {
    return create(defaultHashFunction(), partitions, factory);
  }

  public HashPartitionedReadWriteStorage(Function<K, Integer> hashFunction,
                                         ImmutableList<CloseableReadWriteStorage<K, V>> partitions) {
    Preconditions.checkArgument(partitions.size() > 0);
    this.hashFunction = hashFunction;
    this.partitions = partitions;
  }

  public HashPartitionedReadWriteStorage(ImmutableList<CloseableReadWriteStorage<K, V>> partitions) {
    this(defaultHashFunction(), partitions);
  }

  @Override public void close() throws IOException {
    for (var partition : partitions) {
      partition.close();
    }
  }

  @Override public long size() throws IOException {
    long total = 0;
    for (var partition : partitions) {
      total += partition.size();
    }
    return total;
  }

  @Override public void put(@NotNull K key, @NotNull V value) throws IOException {
    getPartition(key).put(key, value);
  }

  @Nullable @Override public V get(@NotNull K key) throws IOException {
    return getPartition(key).get(key);
  }

  @Override public boolean delete(@NotNull K key) throws IOException {
    return getPartition(key).delete(key);
  }

  private ReadWriteStorage<K, V> getPartition(@NotNull K key) {
    return partitions.get(Math.abs(hashFunction.apply(key)) % partitions.size());
  }
}
This class maintains no mutable states of its own and therefore requires no locking. All of its methods can be concurrently used by multiple threads with no coordination. The partitions are entirely decoupled and individual partitions can perform any locking they need internally to support multiple concurrent operations on that single partition.
While in present work we'll use our new
HashPartitionedReadWriteStorage
class to encapsulate a
collection of
LSMTree
partitions, the class is quite general and can be reused in future projects that
consider different partition storage engines.
Unit Testing Our Partitioned LSMTree
Keeping with
my promise to develop unit tests for our projects,
we now develop some correctness tests for our new
HashPartitionedReadWriteStorage
using four
LSMTree
partitions. The previously developed
ReadWriteStorageTester
is reused to perform
a series of operations on the new storage engine and verify that it maintains the correct state.
public class PartitionedLsmTreeTest {

  ...

  @Test public void testMultiThread() throws Exception {
    var directoryAndStorage = createPartitionedLsmTree(1000);
    var operations = directoryAndStorage.getLeft();
    var tree = directoryAndStorage.getRight();
    var errors = new AtomicInteger(0);
    var threads = Streams.concat(
        Stream.of(
            createThread(tree, PutDeleteGet.PUT_HEAVY, KnownKeyRate.LOW, true, errors, operations),
            createThread(tree, PutDeleteGet.DELETE_HEAVY, KnownKeyRate.HIGH, false, errors, operations)),
        IntStream.range(0, 8).mapToObj(i ->
            createThread(tree, PutDeleteGet.GET_HEAVY, KnownKeyRate.HIGH, false, errors, operations)
        )).collect(Collectors.toList());
    threads.forEach(Thread::start);
    for (var thread : threads) {
      thread.join();
    }
    assertThat(errors.get()).isZero();
  }

  private Thread createThread(HashPartitionedReadWriteStorage<ByteArrayWrapper, ByteArrayWrapper> store,
                              PutDeleteGet putDeleteGet, KnownKeyRate knownKeyRate,
                              boolean callback, AtomicInteger errors, MemoryFileDirectoryOperations operations) {
    var builder = ReadWriteStorageTester.builderForBytes(store, new Random(), 16, 4096)
        .debug(false)
        .checkSize(false)
        .checkDeleteReturnValue(false);
    if (callback) {
      var count = new AtomicInteger(0);
      builder.iterationCallback((ignored) -> {
        assertThat(errors.get()).isZero();
        if (count.incrementAndGet() % 1000 == 0) {
          LOGGER.info("iteration " + count.get() + " size " + Dbf0Util.formatBytes(getDirectorySize(operations)));
        }
      });
    } else {
      builder.iterationCallback((ignored) -> assertThat(errors.get()).isZero());
    }
    var tester = builder.build();
    return new Thread(() -> {
      try {
        tester.testPutDeleteGet(25 * 1000, putDeleteGet, knownKeyRate);
      } catch (Exception e) {
        LOGGER.log(Level.SEVERE, e, () -> "error in thread");
        errors.incrementAndGet();
      }
    });
  }

  private Pair<MemoryFileDirectoryOperations, HashPartitionedReadWriteStorage<ByteArrayWrapper, ByteArrayWrapper>>
  createPartitionedLsmTree(int pendingWritesDeltaThreshold) throws IOException {
    var directoryOperations = new MemoryFileDirectoryOperations();
    var executor = Executors.newScheduledThreadPool(4);
    var store = HashPartitionedReadWriteStorage.create(4,
        partition -> {
          var tree = LsmTree.builderForTesting(directoryOperations.subDirectory(String.valueOf(partition)))
              .withPendingWritesDeltaThreshold(pendingWritesDeltaThreshold)
              .withScheduledExecutorService(executor)
              .withIndexRate(10)
              .withMaxInFlightWriteJobs(10)
              .withMaxDeltaReadPercentage(0.5)
              .withMergeCronFrequency(Duration.ofMillis(100))
              .build();
          tree.initialize();
          return tree;
        });
    return Pair.of(directoryOperations, store);
  }
}
Benchmarking
We adapt the benchmarking methods and code from the LSMTree project. Using insights from that project, present benchmarking focuses on scenarios with the following constant parameters.
| Parameter | Value | Description |
|---|---|---|
| Key Find Rate | 50% |
The rate at which
Delete
and
Get
requests use a key from a previous
Put
request, versus a randomly generated key
|
| Write Delta Threshold | 1 Million | The number of keys to collect in memory within a single LSMTree before writing them as a delta |
| Key Space Size | 100 Million | Key byte arrays are randomly generated such that there are 100 million possible unique keys |
| Value Size | 1024 bytes | The length of value associated with keys |
We again consider four different types of workloads that differ in the relative frequency at which they perform
Put,
Delete, and
Get
requests.
| Operation Frequency (%) | |||
|---|---|---|---|
| Workload | Put | Delete | Get |
| PUT_HEAVY | 90 | 5 | 5 |
| GET_HEAVY | 10 | 5 | 85 |
| DELETE_HEAVY | 45 | 45 | 10 |
| BALANCED | 33 | 33 | 34 |
For each workload, we run benchmark trials with different combinations of the following two parameters.
| Parameter | Values | Description |
|---|---|---|
| Partitions | 1, 4, 8, and 16 | The number of partitions, each consisting of an independent LSMTree |
| Thread Count | 1, 4, 16, and 32 | The number of threads concurrently performing operations against our partitioned LSMTree |
Note that thread count doesn't include threads used to write deltas or the threads used to run the background delta/base merging cron jobs.
During the benchmarking run, we count the number of
Put,
Delete, and
Get
requests to quantify performance. Whereas previously we only counted the total number of each
request type performed during the full trial, the benchmarking in this project records counts every 10 seconds.
This allows us to analyze the time dependent behavior of our new key/value store and answer questions like, "Did
the performance slow down as the data store grew over time."
Each benchmarking trial begins with zero entries in the key/value store and the data size grows over time. Hence, we run each benchmark scenario for one hour to allow for the data size to grow sufficiently large. In addition to tracking the number of operations performed, we also record the total size of all files used by all LSMTees in our partitioned store at each ten second interval to track data size.
We again use AWS EC2 instances with high-performance NVMe drives to provide a standard testing environment and to allow us to run multiple benchmark runs in parallel using multiple instances. Only one benchmark trial is ran at a time on each instance to prevent them from competing with each other for resources.
| Attribute | Value |
|---|---|
| Instance Type | i3.2xlarge |
| Provisioned Input/Output Ops/Second (IOPs) | 180,000 |
| vCPUs | 8 |
| RAM | 61 GiB |
| OS Image | Ubuntu 18.04 LTS - Bionic |
| Kernel | Linux version 4.15.0-1065-aws |
| JRE | OpenJDK 64-Bit Server VM version 11.0.6 |
The following benchmarking harness is developed to run benchmarking trials. Since it shares similarities to benchmarking code in previous projects, only selects novel details are included here for brevity.
public class Benchmark {

  ...

  static void waitDuration(Duration duration, AtomicReference<Stats> stats,
                           AtomicInteger errors, File file) {
    var sleepInterval = 10L * 1000L;
    IntStream.range(0, (int) (duration.toMillis() / sleepInterval)).forEach(index -> {
      if (errors.get() != 0) {
        return;
      }
      try {
        Thread.sleep(sleepInterval);
        var currentStats = stats.getAndSet(new Stats());
        currentStats.fileSize.set(fileSize(file));
        currentStats.nanoTime.set(System.nanoTime());
        System.out.println(currentStats.toJson());
      } catch (InterruptedException e) {
        throw new RuntimeException(e);
      }
    });
  }

  static class Stats {
    final AtomicLong nanoTime = new AtomicLong(0);
    final AtomicLong countPut = new AtomicLong(0);
    final AtomicLong countDelete = new AtomicLong(0);
    final AtomicLong countDeleteFound = new AtomicLong(0);
    final AtomicLong countGet = new AtomicLong(0);
    final AtomicLong countFound = new AtomicLong(0);
    final AtomicLong fileSize = new AtomicLong(0);

    ImmutableMap<String, Long> getMap() {
      return ImmutableMap.<String, Long>builder()
          .put("nanoTime", nanoTime.get())
          .put("put", countPut.get())
          .put("delete", countDelete.get())
          .put("deleteFound", countDeleteFound.get())
          .put("get", countGet.get())
          .put("getFound", countFound.get())
          .put("fileSize", fileSize.get())
          .build();
    }

    String toJson() {
      return new Gson().toJson(getMap());
    }
  }

  private static HashPartitionedReadWriteStorage<ByteArrayWrapper, ByteArrayWrapper>
  createPartitionedLsmTree(Iterator<String> argsItr, File directory) throws IOException {
    var pendingWritesMergeThreshold = Integer.parseInt(argsItr.next());
    var indexRate = Integer.parseInt(argsItr.next());
    var partitions = Integer.parseInt(argsItr.next());
    var executor = Executors.newScheduledThreadPool(8);

    var base = new FileDirectoryOperationsImpl(directory);
    base.mkdirs();
    base.clear();

    return HashPartitionedReadWriteStorage.create(partitions,
        partition -> createLsmTree(base.subDirectory(String.valueOf(partition)),
            pendingWritesMergeThreshold, indexRate, executor));
  }

  private static LsmTree<FileOutputStream> createLsmTree(FileDirectoryOperationsImpl directoryOps,
                                                         int pendingWritesMergeThreshold, int indexRate,
                                                         ScheduledExecutorService executorService) throws IOException {
    directoryOps.mkdirs();
    directoryOps.clear();

    var tree = LsmTree.builderForDirectory(directoryOps)
        .withPendingWritesDeltaThreshold(pendingWritesMergeThreshold)
        .withScheduledExecutorService(executorService)
        .withIndexRate(indexRate)
        .withMaxInFlightWriteJobs(20)
        .withMaxDeltaReadPercentage(0.75)
        .withMergeCronFrequency(Duration.ofSeconds(1))
        .build();

    tree.initialize();
    return tree;
  }
}
Analysis of Benchmarking Results
Impact of Partitioning and Threading
We start by analyzing the impact of partition count on each of the four workloads considered. For each workload
and partition count combination, we select the thread count scenario that gave the highest overall performance.
Performance is quantified by sum operations per a second (ops/s) averaged over the entire benchmarking run, with
the sum being over
Put,
Get, and
Delete
operation counts. In addition to
showing the ops/s for each partition, results with more than one partition show the relative change in performance
with respect to the single partition case.
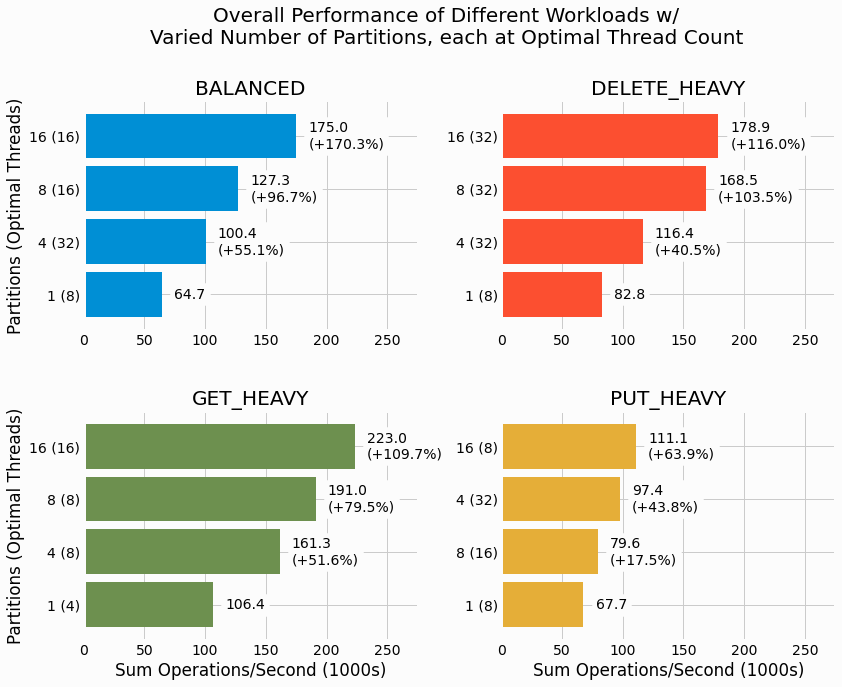
We see that partitioning substantially increases the overall performance for all four workloads. The largest
gain is seen for the
BALANCED
workload where 16 partitions are found to increase ops/s by 170%
relative to the single partition case. The
PUT_HEAVY
workload has the most modest gains in
performance, yet using 16 partitions still adds 64% more ops/s. We'll consider why different workloads benefit more
or less from partitioning in the discussion section of this project.
Next we look at how thread count impacts performance when using the maximum number of partitions, 16.
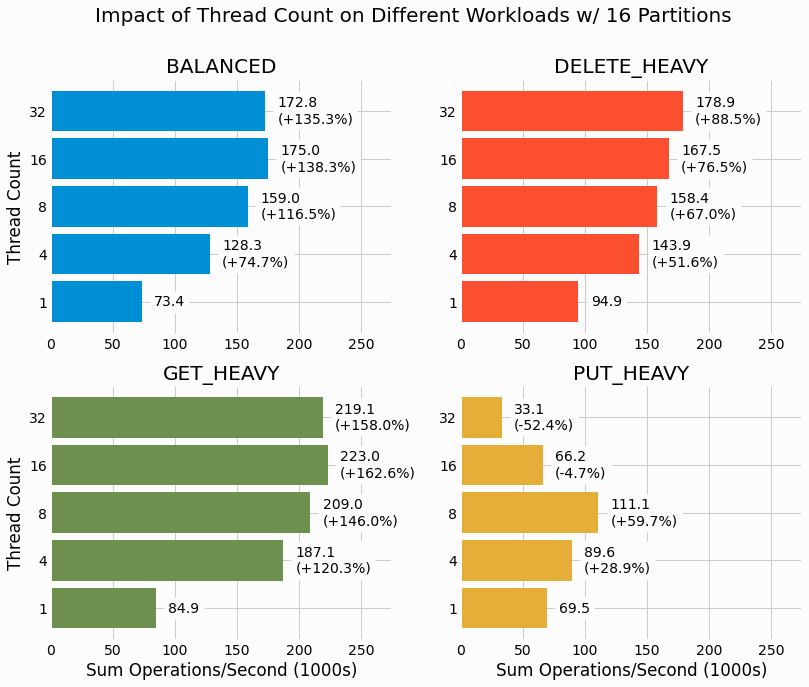
For
DELETE_HEAVY, performance is found to increase with increasing thread count all the way up 32.
BALANCED
and
GET_HEAVY
both have an optimal thread count of 16, with very small drop off
when increasing to 32. In contrast,
PUT_HEAVY
reaches an optimal thread count at 8 and there are
severe performance drops for further increasing thread count. Both the 16 and 32 thread count results under perform
relative to even the singled threaded case. This is quite unexpected and we'll be further investigating this when
we consider time dependent results.
We return to studying the impact of partitioning, this time holding thread count fixed at the maximum value of 32 threads performing concurrent operations on the partitioned LSMTree.
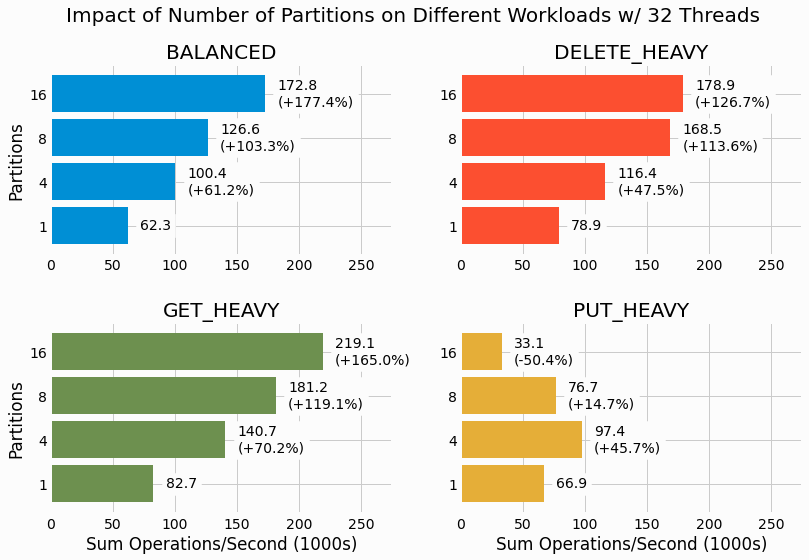
For three of the workloads, performance continually improves with increasing partition count. Yet again we see
PUT_HEAVY
showing a different trend with optimal performance reached at 4 partitions and performance
dropping with a further increase of partitions. The 16 partition case even under performs relative to the single
partition case for the workload with 32 threads. This adds to our observation that
PUT_HEAVY
has
unique scaling characteristics relative to the other workloads considered.
Relationship Between Data File Size and Performance
In analyzing the benchmarking results of our original, un-partitioned LSMTree, the performance was found to be strongly related to the total size of all files used by the LSMTree at the end of the benchmark. This is explained by larger data size requiring more I/O operations and also less potential for the operating system page cache to augment disk performance.
We therefore investigate the relation between file size and performance of the new partitioned LSMTree. File size includes all files and use by all of the LSMTrees in the partitioned storage engine. We select the maximum value of the quantity within the last ten minutes of each benchmark to account for the impact of merging deltas into the base and then deleting these deltas. The following figure shows this relationship for each workload and partition count combination at that combination's optimal thread count. Marker color denotes the workload and different shapes are used to differentiate partition count values.
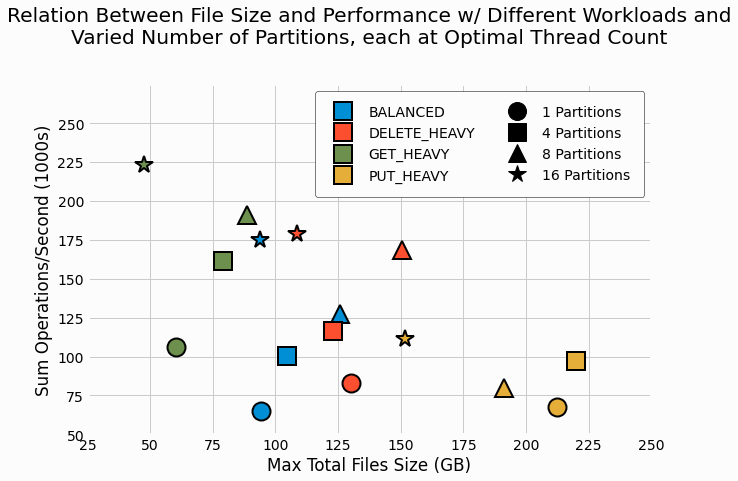
These results largely mirror those of the un-partitioned LSMtree with
GET_HEAVY
workloads showing
the smallest file sizes and the highest performance. Similar to past results,
PUT_HEAVY
is found to
have the largest files and the lowest performance. Within each workload, we can see how performance is enhanced
with increasing partitions. One interesting observation consists of the 16 partition case (as shown by star
markers) commonly having not only higher performance, but surprisingly also showing smaller files sizes relative to
the other scenarios for the same workload. We'll speculate on the source of these unexpectedly smaller files in the
discussion section.
Analysis of Time-Dependent Performance and File Size
Lastly, we use the newly developing benchmarking capability of recording operation counts throughout benchmarking to investigate how the performance of our new key/value store varies over time. In addition to plotting the performance, as quantified by sum ops/sec, we also plot the total size of files used by the partitioned LSMTree at each point in time.
The following figure shows the results for the
BALANCED
workload with 16 partitions and 16 threads.
The top axes shows the results for the full duration of the trial and the bottom axes zooms in on a specific region
of time to better show details. Each axes has two different y-axises to show the sum ops/s and total file size,
which have different scales and units. The left y-axis axis shows performance and the right y-axis shows file
size.
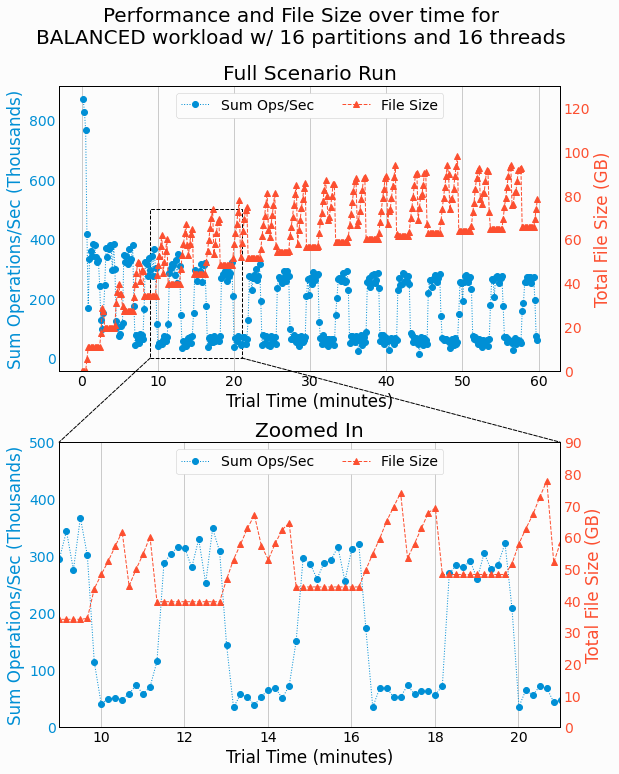
These results are quit interesting. We can see the total file size fluctuating with periodic behavior, while also generally increasing as more keys are added to the store. The periodic behavior can be explained by deltas being created, then merged into a new base (into a temporary file), and then finally deleting the deltas and the previous base. During delta generation and merging, more disk space is used and in deleting the no-longer-needed files, the disk space drops considerably. After generating a delta, an LSMTree accumulates writes in memory until enough writes are accumulated to produce another delta. During these periods, we see disk usage holding constant. Remember, there are 16 separate LSMTrees, each generating deltas and merging their deltas with their own base. The LSMTrees have identical configuration and receive similar similar volume of writes so there is some synchronization in their behavior, which gives the overall periodic trends of the partitioned LSMTree.
Further, we find the overall performance of the partitioned LSMTree is tightly coupled with the file size. This
is best seen on the lower, zoomed-in axes. During the periods of constant files size, when deltas aren't being
generated nor merged with the base, we see the store's performance is commonly as high as 300k ops/sec. Yet as soon
as write IO start, we see performance dropping to less than 100k ops/sec. While this wasn't expected, it makes
sense considering the competition between disk reads from
GET
requests, writes in delta generation,
and the combination of reads and writes in delta/base merging.
Next, we apply this analysis to a
PUT_HEAVY
workload that showed unusual behavior, with worse
scaling as threads and/or partitions are maxed out. The following figure shows the time dependence performance and
file size for this workload with 16 partitions and 32 threads performing concurrent operations on the partitioned
LSMTree.
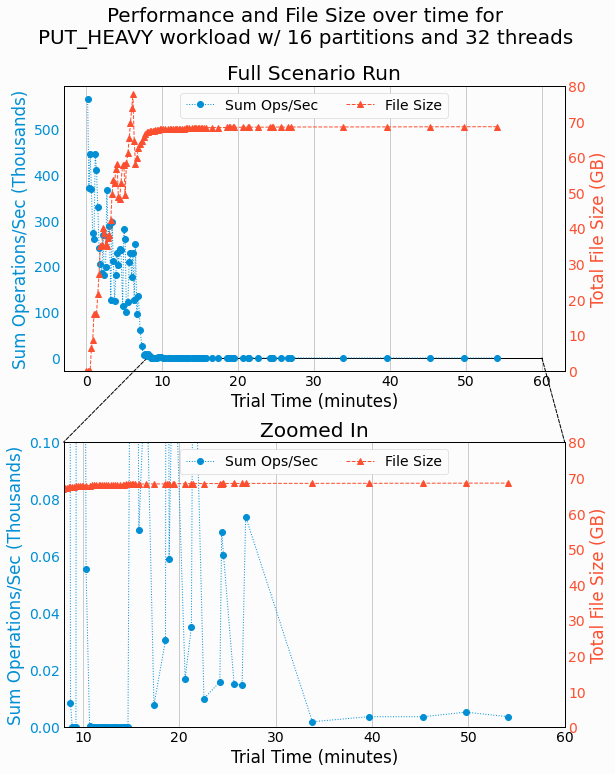
Wow! We see performance starting out strong and then dropping astronomically around the 9 minute mark. Performance remains massively degraded for the rest of the trial. If it weren't for the zoomed in plot, I'd personally believe the program had hung somewhere and wasn't performing any operations. Yet, the zoomed-in plot shows a miniscule volume of operations being performed, commonly as low as 10 ops/sec. Further, we can see long periods of time between some data points, which shows the benchmarking harness isn't reporting results at the configured threshold of 10 seconds. These results certainly warrant a further investigation into why our partitioned LSMTree is showing such abysmal performance in this scenario.
Debugging the Abysmal Performance of PUT_HEAVY Workloads With High Levels of Concurrency
The
PUT_HEAVY
workload with 16 partitions and 32 threads is re-ran with manual monitoring. Logs are
monitored until performance drops considerably. Then a simple
jstack
of the running process to show
the traceback of every thread quickly shows us the problem.
$ jstack Benchmark | grep java.lang.Thread.State | sort | uniq -c
     20    java.lang.Thread.State: RUNNABLE
      1    java.lang.Thread.State: TIMED_WAITING (on object monitor)
      1    java.lang.Thread.State: WAITING (on object monitor)
     28    java.lang.Thread.State: WAITING (parking)
At this instance int time, there are 20 threads trying to run on host that only has 8 vCPUs. Running
htop
confirms that the CPUs are fully saturated and running at the highest possible load level.
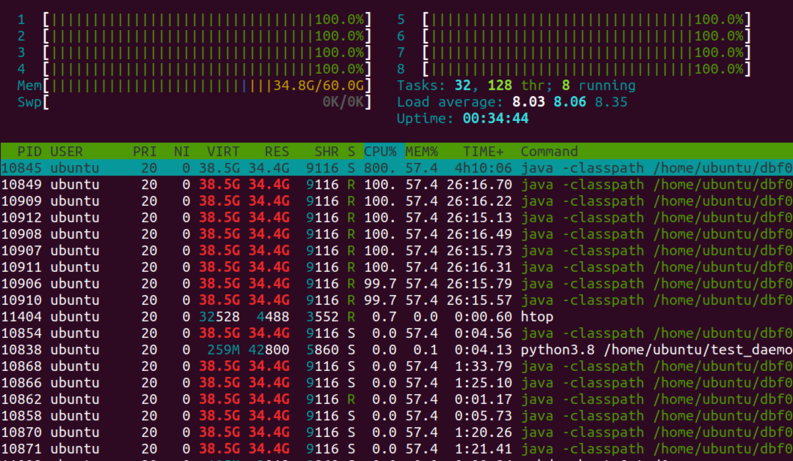
Hence, we're simply trying to do much on one machine. The operating system has to keep shuffling threads in and out of cores and therefore no single thread can make much progress. This is further complicated by the extensive requirement of exclusive locks for writes within each partition, which can lead a thread to block before its short amount of allocated time on a CPU is even up.
This solves the mystery of why
PUT_HEAVY
workloads can under perform as threads and/or partitions
are further increased and we'll consider what's special about
PUT_HEAVY
workload in the discussion
section.
Discussion and Next Steps
While it was quite simple for us to develop a hash partitioning layer for our LSMTree storage engine, it certainly has a substantial impact on performance. In the benchmarked scenarios, we commonly see overall performance doubling. This is attributed to partitioning allowing for concurrent writes in separate partitions as can be performed without coordination. The previous bottleneck of requiring writes to lock the entire storage engine is removed and overall performance increases considerably.
There are drawbacks to hash partitioning that will become relevant when we develop additional features for our key/value store. For example, table scans are a common operation where a query requests to read all records for a range of keys. While the LSMTree's index allows us to efficiently determine where the key range starts and ends within each delta or base file, we still have to read files from every partition because keys are evenly distributed across partitions.
This can be overcome using range partitioning, whereby each partition corresponds to a contiguous range of keys. Table scans are then limited to a smaller number of partitions, commonly a single partition. Range partitioning has its own challenges in determining the appropriate range of keys to assign to each partition. Further, range partitioning has to adapt to changes in the overall distribution of keys as new ones are added and old one deleted. We'll explore range partitioning in a future project and quantify the trade offs of each partitioning approach through benchmarking different workloads.
In benchmarking the performance of our hash partitioned LSMTree, it is quite interesting how the
PUT_HEAVY
workload differs in scaling behavior with increasing threads and partitions. For the other
workloads of
GET_HEAVY,
DELETE_HEAVY, and
BALANCED, performance generally
improves with increasing partitions and thread count, with modest drop offs for the highest values in some
workloads. In contrast,
PUT_HEAVY
is found to achieve optimal performance with 16 partitions and 8
threads and from there performance drops off considerably with increasing thread count. Similarly, increasing
partitions beyond 4 when using 32 threads also shows substantially degraded performance for
PUT_HEAVY.
In investigating the time dependent performance of a
PUT_HEAVY
workload with 16 partitions and 32
threads, we find a massive drop off in performance starting at around 9 minutes of the 60 minute benchmark.
Performance remains degraded for the rest of the benchmarking trial. In manually monitoring this trial, we find
host CPUs are massively oversubscribed with 20 threads trying to run on only 8 CPUs. Hence, the abysmally lower
performance.
This begs the question, "why does
PUT_HEAVY
require so much more CPU resources than other workloads
at comparable levels of concurrency?" I can think of several areas of a
PUT_HEAVY
workload with
LSMTree storage that could be compute intensive.
-
Generating random key and value byte arrays for
PUToperations - Resizing of the hash tables used to collect writes in memory whenever a hash table grows to capacity
- Garbage collection of the key and value byte arrays generated for put requests as well as all of the hash table entries freed when a collection of pending writes is completed
- Sorting batches of key/value pairs for writing to disk
- Comparison operations in the merge-sort join for combing deltas and base
Seeing as performance degrades so much as to prevent the store from accumulating enough writes to generate a delta, we can rule out 4 and 5. Hence, we're left with 1, 2, and 3. It is quite reasonable that 32 threads cannot concurrently populate 16 hash tables with randomly generated data using only 8 vCPUs.
The
DELETE_HEAVY
workload shares some similarities to
PUT_HEAVY
in that it generates
writes that need to be collected in memory, yet doesn't show this behavior. There are two key differences.
-
DELETE_HEAVYwill use an existing key from a previousPUToperation 50% of the time at the configured Key Find Rate of 50%. -
No values are randomly generated for
DELETEoperations.
These differences seem sufficient to allow
DELETE_HEAVY
to scale up to 16 partitions and 32
threads.
These results for
PUT_HEAVY
show that a disk-based key/value store can still be limited on CPU
resources. In general, we'd expect IO to be the bottleneck, yet these results demonstrate that when using
high-performance NVMe drives and performing IO in parallel, we can be compute blocked when there are sufficient
operations that need to be performed in memory.
While this project greatly improves the performance of our key/value store, it still has a considerable deficiency; the storage engine is not durable. With writes collected in memory for batch persistence to disk, writes would be lost should the process crash or if the machine itself crashes or loses power. We'll address this in our next project where we'll introduce write-ahead logging to keep a record of all write operations on disk. Such logs aren't sorted and indexed and therefore aren't useful for random reads, but instead they provide a durable record of all operations performed and allow a database to recover from crashes by reading the log and performing any write operation that wasn't persisted to disk due to the crash. Check out Write-Ahead Logging for Durable Key/Value Persistence to learn how to develop write-ahead logs for our key/value store.